Financial KPIs are not just accounting tools. They are decision-making instruments that shape how businesses invest, grow, and respond to changing conditions. For CFOs, these indicators reveal whether capital is being used wisely. For business analysts, they offer a lens into the operational realities behind the numbers.
Too often, companies either track everything or focus on the wrong metrics. The result is cluttered dashboards, misaligned goals, and reports that fail to drive action. A well-chosen KPI should do more than show a number. It should provoke a decision, prompt a question, or highlight an opportunity.
This article breaks down the most essential financial KPIs with clarity and context. Each section includes not only the formula, but also when to use it, how to interpret it, and what it means for business performance. Whether you’re optimizing cash flow, managing risk, or presenting to the board, the right KPI can give your insights more weight and your decisions more confidence.
What Are Financial KPIs (and Why They’re Not Just for Accountants)
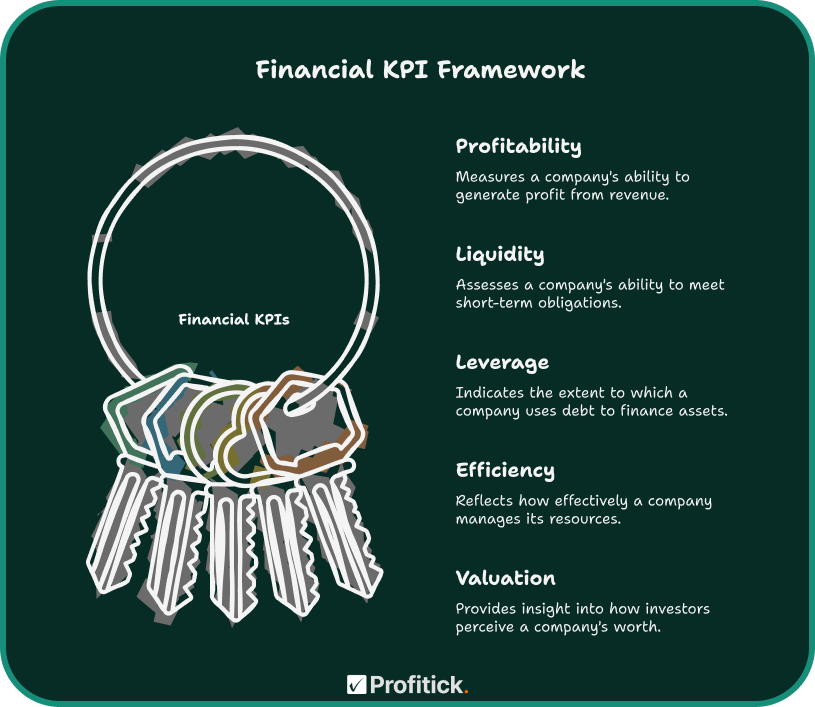
A financial KPI, or key performance indicator, is a measurable value that reflects the financial health and operational effectiveness of a business. These aren’t just numbers for closing the books. They are tools for making decisions, spotting problems early, and guiding long-term strategy.
At their core, financial KPIs help you answer questions like:
- Are we using capital efficiently?
- Is our profitability sustainable?
- Can we meet our short-term obligations without stress?
- Are we earning a return that justifies the risk?
While accountants often calculate these metrics, it’s analysts, CFOs, and business leaders who apply them. For example, an operations manager might monitor gross profit margin to evaluate pricing efficiency. A CFO might use return on invested capital to assess whether it’s time to expand. These aren’t theoretical numbers. They affect hiring decisions, investment timing, and pricing strategies.
It’s also important to understand that not all financial metrics are KPIs. A KPI is meaningful only when it links directly to a business goal. Tracking every number leads to noise. Tracking the right ones creates clarity.
Whether you’re building forecasts, managing investor expectations, or leading a turnaround effort, knowing which KPIs matter and why, can shift the way you manage performance.

How to Choose KPIs That Actually Matter
Not every metric deserves space on your dashboard. One of the biggest mistakes finance teams make is treating all numbers equally. A cluttered report might look comprehensive, but if it doesn’t drive action, it’s just noise.
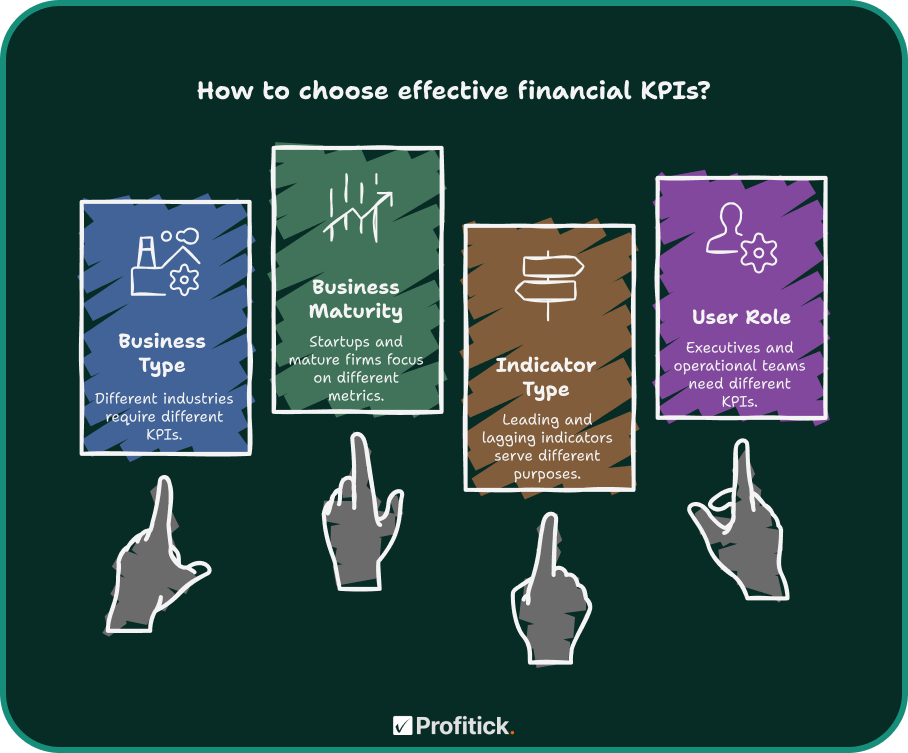
The most effective financial KPIs are the ones tied to real decisions. Choosing them starts with understanding your business model and your goals.
If you’re running a SaaS company, recurring revenue metrics like customer lifetime value (LTV) or churn rate will likely matter more than inventory turnover. A manufacturing CFO, on the other hand, might prioritize gross margin per production unit or days sales of inventory. Industry matters. So does business maturity. Startups need to watch burn rate. Mature firms care more about return on equity or cost of capital.
It’s also helpful to distinguish between leading and lagging indicators. Lagging KPIs, like net profit margin, show outcomes. Leading KPIs, like sales pipeline value or inventory turnover, help forecast future performance. A healthy finance strategy includes both.
Finally, consider who is using the KPI. Executives may need broader indicators like EBITDA margin or free cash flow. Operational teams may benefit more from cost per unit or cash conversion cycle. One-size-fits-all reporting tends to serve no one well.
The right KPI connects data to action. If it doesn’t influence a decision or highlight a risk, it probably doesn’t belong on your list.

12 Essential Financial KPIs for Business Analysts & CFOs
1. Gross Profit Margin
Definition:
Gross profit margin measures how efficiently a company produces its goods or services relative to revenue. It indicates the percentage of sales revenue that exceeds the cost of goods sold (COGS).
Formula:
Gross Profit Margin = ((Revenue − COGS) ÷ Revenue) × 100
Interpretation:
A higher margin suggests better production efficiency or stronger pricing power. If gross margin falls over time, it may signal rising input costs or aggressive discounting.
Practical Use:
CFOs often track gross profit margin across product lines to identify profitability gaps. Business analysts may benchmark this metric against industry averages to assess operational competitiveness. It also helps inform pricing strategy, cost control measures, and supplier negotiations.
2. Operating Cash Flow (OCF)
Definition:
Operating cash flow reflects the actual cash generated by a company’s core operations, excluding investing and financing activities. It offers a real-world look at whether the business can sustain itself without outside funding.
Formula:
OCF = Net Income + Non-Cash Expenses − Changes in Working Capital
(Note: This is the indirect method, commonly used in practice.)
Interpretation:
Consistently positive OCF indicates a healthy, self-sustaining operation. Negative OCF in a mature company is a red flag and may suggest problems with receivables, inventory, or pricing.
Practical Use:
Analysts use OCF to validate profitability quality. A company reporting strong net income but weak cash flow may be manipulating accruals or facing slow customer payments. CFOs also use it to plan for reinvestment or to assess debt repayment capacity.
3. Net Profit Margin
Definition:
Net profit margin measures how much of a company’s revenue remains as profit after all expenses, including operating costs, interest, taxes, and depreciation.
Formula:
Net Profit Margin = (Net Income ÷ Revenue) × 100
Interpretation:
A healthy net profit margin shows the company is managing both its operations and overhead effectively. Low or volatile margins may point to cost overruns, pricing issues, or unfavorable tax structures.
Practical Use:
CFOs rely on this metric to track overall profitability and guide strategic decisions like cost restructuring or divestment. It’s also a key ratio in investor reports and board-level discussions.
4. Current Ratio
Definition:
The current ratio measures a company’s ability to meet its short-term obligations using its short-term assets. It’s a basic but important indicator of liquidity.
Formula:
Current Ratio = Current Assets ÷ Current Liabilities
Interpretation:
A ratio above 1.0 suggests the company can cover its short-term debts with assets on hand. A ratio that’s too high may indicate underutilized capital, while a low ratio signals potential liquidity risk.
Practical Use:
Business analysts track the current ratio when evaluating working capital management. CFOs may use it to determine whether to adjust credit terms, tighten receivables, or reduce inventory levels.
5. Debt-to-Equity Ratio
Definition:
The debt-to-equity ratio shows how much of the company is financed by debt compared to shareholders’ equity. It reveals the firm’s capital structure and financial leverage.
Formula:
Debt-to-Equity Ratio = Total Liabilities ÷ Shareholders’ Equity
Interpretation:
A high ratio suggests greater reliance on borrowed funds, which can magnify returns but also increase risk. A low ratio indicates conservative financing but may limit growth potential.
Practical Use:
CFOs monitor this ratio when considering new loans, equity raises, or refinancing. It’s also critical in assessing the company’s resilience during downturns. Industry benchmarks matter here—capital-heavy industries may operate with higher ratios than software firms, for example.
6. Revenue Growth Rate
Definition:
Revenue growth measures the percentage increase (or decrease) in sales over a defined period. It reflects the company’s ability to expand its market presence and customer base.
Formula:
Revenue Growth Rate = ((Current Period Revenue − Prior Period Revenue) ÷ Prior Period Revenue) × 100
Interpretation:
Consistent growth often signals a strong product-market fit and effective go-to-market strategy. Slowing growth may prompt closer analysis of market saturation, churn, or competitive pressure.
Practical Use:
This metric helps CFOs plan budgets, allocate marketing spend, and evaluate product performance. Analysts often break down growth by region, product line, or customer segment to spot high-performing areas or underperformance early.
7. Return on Equity (ROE)
Definition:
Return on equity measures how effectively a company generates profit from the money invested by shareholders. It reflects both operational performance and capital efficiency.
Formula:
ROE = Net Income ÷ Shareholders’ Equity
Interpretation:
A high ROE signals that the business is using investor capital wisely to generate returns. A very high ROE, however, can sometimes be a result of excessive debt rather than efficient operations, so context matters.
Practical Use:
CFOs use ROE to evaluate the financial performance of business units or new initiatives. It’s also closely watched by investors, especially in equity-heavy sectors where shareholder return is a primary benchmark.
8. Earnings Before Interest and Taxes (EBIT)
Definition:
EBIT is a measure of a company’s operating profitability, excluding the effects of financing and tax strategies. It’s often used to evaluate the performance of core business operations.
Formula:
EBIT = Revenue − Operating Expenses (excluding interest and tax)
Interpretation:
This metric reveals whether a company’s day-to-day operations are generating profit before external factors like debt or tax codes come into play. A rising EBIT trend typically signals improving operational strength.
Practical Use:
Analysts use EBIT to compare operational profitability across companies regardless of how they’re financed. It’s also a key input in valuation models like enterprise value to EBIT (EV/EBIT).
9. EBITDA Margin
Definition:
EBITDA margin measures a company’s earnings before interest, tax, depreciation, and amortization as a percentage of revenue. It reflects the underlying profitability before non-cash and non-operating expenses.
Formula:
EBITDA Margin = (EBITDA ÷ Revenue) × 100
Interpretation:
This metric is useful for understanding operational scalability and margin structure. It strips away variables like capital intensity and debt to give a clean view of performance.
Practical Use:
CFOs track EBITDA margin to assess how much profit the company retains from each dollar of revenue before financing and accounting impacts. Investors often use this to compare performance across industries or regions where tax and capital structures vary widely.
10. Days Sales Outstanding (DSO)
Definition:
Days sales outstanding measures the average number of days it takes a company to collect payment after a sale has been made. It is a key indicator of accounts receivable efficiency.
Formula:
DSO = (Accounts Receivable ÷ Total Credit Sales) × Number of Days
Interpretation:
A lower DSO means the company is collecting payments quickly, which supports healthy cash flow. A higher DSO suggests delays in collections and potential credit risk.
Practical Use:
Business analysts monitor DSO to flag issues in billing, collections, or customer credit policies. CFOs often include it in working capital reviews or cash flow projections, especially when evaluating seasonal impacts on liquidity.
11. Free Cash Flow (FCF)
Definition:
Free cash flow represents the cash a business generates after accounting for capital expenditures. It reflects the money available to pay dividends, reduce debt, or reinvest in growth.
Formula:
FCF = Operating Cash Flow − Capital Expenditures
Interpretation:
Positive FCF indicates the company is generating surplus cash beyond what is needed to maintain or grow its asset base. Negative FCF is not always bad, but it should be linked to strategic investment.
Practical Use:
CFOs use FCF to make funding decisions. If cash is tight, they may delay expansion or reduce distributions. Analysts often use this metric in valuation models, particularly discounted cash flow (DCF) calculations.
12. Return on Invested Capital (ROIC)
Definition:
ROIC measures how well a company generates returns relative to the capital it has invested in its operations. It’s a key indicator of long-term value creation.
Formula:
ROIC = Net Operating Profit After Taxes (NOPAT) ÷ Invested Capital
Interpretation:
A ROIC above the company’s cost of capital signals that the business is generating value for investors. A falling ROIC trend may suggest capital is being allocated inefficiently.
Practical Use:
CFOs and strategy teams rely on ROIC when evaluating mergers, acquisitions, or new product lines. It supports capital budgeting decisions and is commonly used by private equity firms to assess portfolio performance.
Applying KPIs to Strategic Decision-Making
Collecting KPIs is only half the job. The real value comes from turning those numbers into decisions that move the business forward. Whether you’re managing risk, allocating capital, or steering a turnaround, the right financial KPIs give you the context to act with confidence.
Let’s take operating cash flow. If it’s consistently strong, you might fund expansion internally rather than taking on debt. If it’s weak—even while revenue looks healthy—it may signal issues with collections or inventory buildup. That prompts a different set of actions entirely.
Or consider gross profit margin. A drop in margin could reflect rising material costs or competitive pricing pressure. The response might be to renegotiate supplier contracts, revisit product mix, or restructure pricing. But you won’t know where to look unless the margin moves first.
CFOs often use KPI trend lines as early warning systems. A gradual decline in ROIC, for example, may show that recent investments aren’t generating the expected return. That’s a cue to reevaluate capital allocation strategies before the board starts asking questions.
Business analysts play a key role here. Their job is not just to report metrics, but to interpret them, ask better questions, and challenge assumptions. The best analysts don’t just show what’s happening. They show what to do next.
Common Mistakes When Using Financial KPIs
Tracking financial KPIs isn’t inherently valuable. It’s how you interpret and apply them that determines their impact. Unfortunately, many teams fall into patterns that undermine the usefulness of even the best metrics.
One common mistake is overloading dashboards with too many KPIs. When everything is a priority, nothing gets the attention it deserves. Focus on a short list of metrics that align directly with your strategic goals.
Another issue is comparing metrics out of context. A 4 percent net profit margin might look weak until you realize it’s in a low-margin industry like retail. Benchmarks matter. So does historical performance.
Teams also get tripped up by relying too heavily on lagging indicators. Metrics like net income or ROI tell you what already happened. If you’re not pairing them with forward-looking indicators—like sales pipeline growth or customer acquisition cost—you’re missing half the picture.
Lastly, don’t assume the KPI explains itself. Numbers are starting points. The real value lies in the questions they raise and the actions they prompt.

Best Tools to Track & Visualize Financial KPIs
Choosing the right tool is less about having dozens of features and more about matching functionality to your team’s size, workflow, and decision-making needs. Here’s how to think about it:
For Small Business Simplicity: QuickBooks & Xero
If you’re running a lean operation, QuickBooks and Xero offer clean, user-friendly dashboards with built-in reports for essential KPIs like cash flow, gross margin, and current ratio. They’re ideal for finance managers who need fast insights without the complexity of an enterprise stack.
For Growing Teams: NetSuite & Sage Intacct
As financial operations grow in scale and complexity, NetSuite and Sage Intacct provide more advanced capabilities. These platforms support consolidated reporting, multi-entity tracking, and customizable dashboards that align with GAAP or IFRS standards.
For Customization: Google Sheets + Add-ons
Analysts who want control and flexibility often prefer Google Sheets. When paired with add-ons or API connectors, it becomes a lightweight but powerful dashboard engine. Ideal for building tailored KPI views, especially for startups or agencies.
For Enterprise Reporting: Power BI & Tableau
For larger organizations or data teams, Power BI and Tableau are top choices. They handle real-time integrations, create visually rich dashboards, and support drill-downs for board-level reporting. Perfect when you need to communicate KPI trends at scale.
Final Takeaway: From Numbers to Impact
Financial KPIs should do more than check a box. They should drive clarity, accountability, and action.
If your reporting feels bloated or disconnected from strategy, step back and focus on the fundamentals:
- Prioritize decision-driven metrics. Start with the questions you need to answer, not the data you happen to have.
- Avoid over-reporting. More metrics don’t mean better insights. Focus on what moves the needle.
- Align KPIs with roles. Your CFO, finance manager, and operations lead may need very different views.
- Pair lagging and leading indicators. Knowing what happened is helpful. Anticipating what comes next is better.
The most effective KPI strategy doesn’t chase complexity. It finds clarity in relevance, consistency, and execution. That’s how financial teams move from reporting performance to actively improving it.
